Community Housing Capacity Analysis
Our team worked on a Community Inventory which involved a comprehensive analysis of our capacity of housing, this includes emergency shelter, temporary housing, and permanent housing. The data is very dense and should be considered a jumping off point as we begin to identify some potential opportunities to better utilize our community resources in our work to reduce homelessness.
We want to be clear about what is included in our data and what is not: The HUD Housing Inventory Count performed annually by the CoC is different from this, but there is some overlap between the two. Additionally, we did not include programs that fall into the next step of transitioning out of homelessness including affordable and subsidized housing.
Community Housing Inventory Report

- 28 Organizations
- 72 Programs
Bed/Unit Type Definitions
We have broken the information down into three housing categories related to supporting those experiencing homelessness: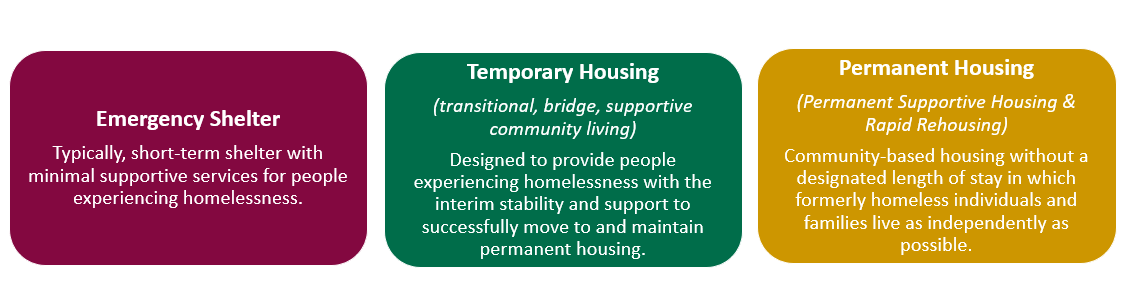
- Emergency Shelter: Typically short-term shelter with minimal supportive services for people experiencing homelessness.
- Temporary Housing (transitional, bridge, supportive community living): Designed to provide people experiencing homelessness with the interim stability and support to successfully move to and maintain permanent housing.
- Permanent Housing (Permanent Supportive Housing and Rapid Rehousing): Community-based housing without a designated length of stay in which formerly homeless individuals and families live as independently as possible.
Community Inventory
We have a total of 3,284 beds in our community for housing those experiencing homelessness.
- This data shows the breakdown of beds based on whether they have gender criteria or if they are reserved for families:
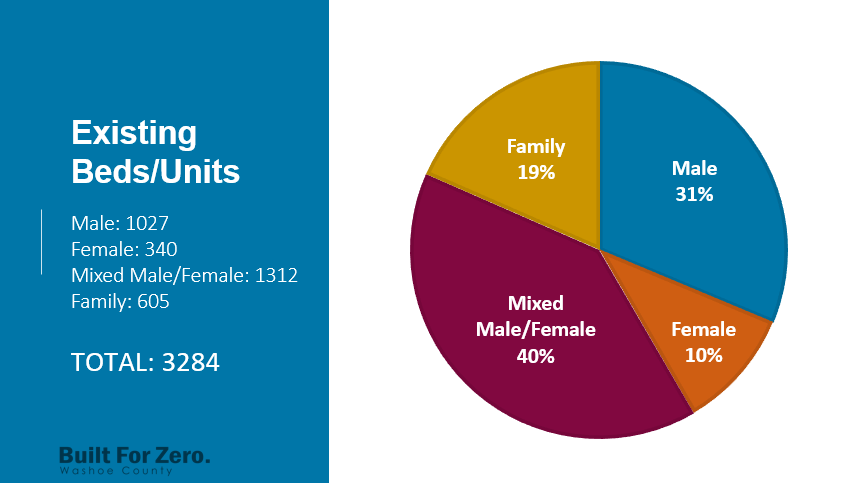
Existing Beds/Units
- Male: 1,027 (31%)
- Female: 340 (10%)
- Mixed Male/Female: 1,312 (40%)
- Family: 605 (19%)
Total: 3,284
This graph further breaks down how those beds are distributed over the various types of housing: 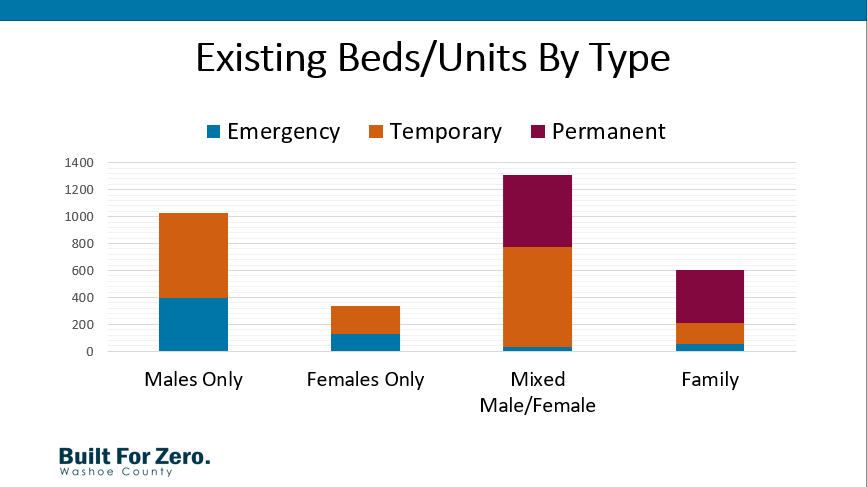
The following graph is the total number of beds we have in each one of our housing types: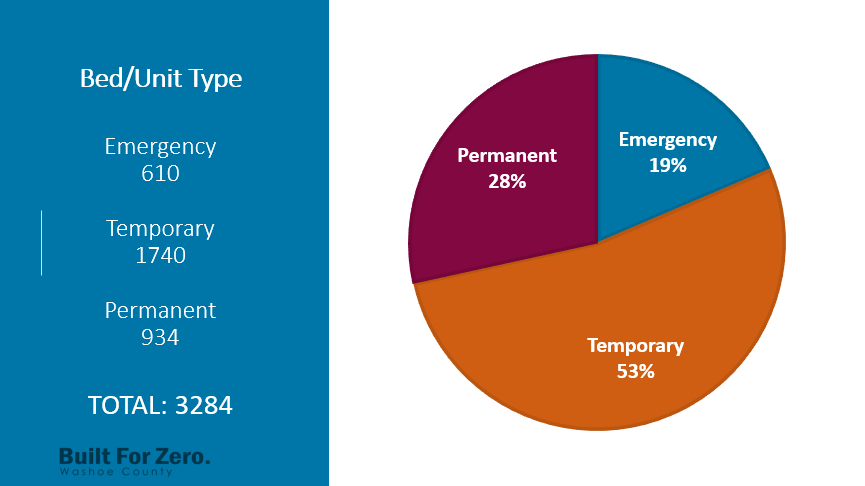
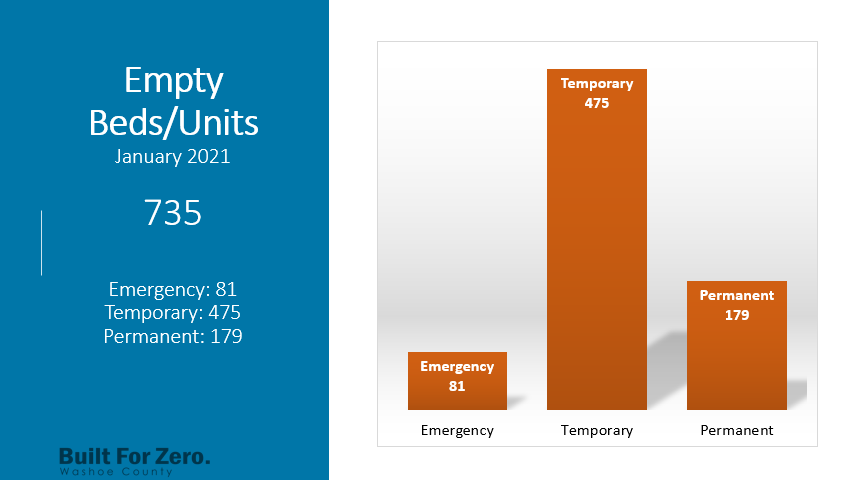
Available Beds/Units
- During our interviews in January 2021, there were 735 available (empty) beds across the three housing types (emergency, temporary and permanent).
- How is it possible that with hundreds of unsheltered people living outside in the middle of winter we have more than 20% of our beds or units sitting empty?
Gaps and needs in our community
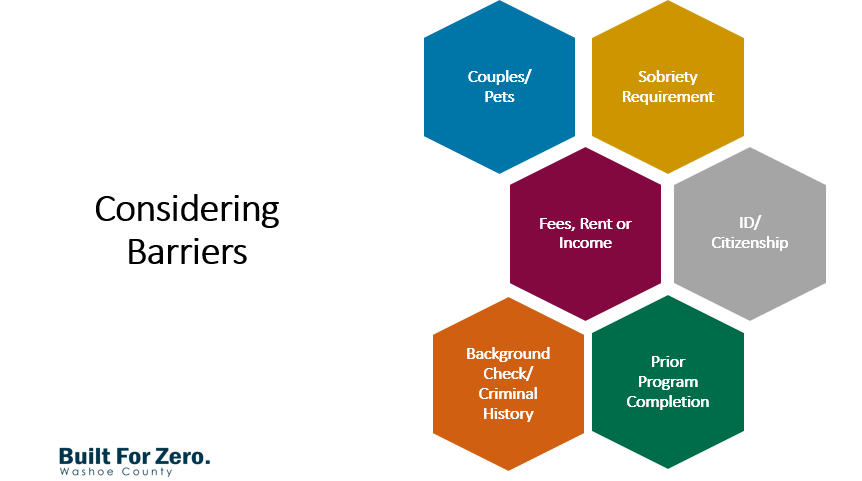
A key reason why beds go un-used is the criteria or barriers associated with those beds do not align with the needs of our unsheltered population.
- We have criteria related to gender and subpopulations. We also have criteria that lead inadvertently to barriers, such as not accepting pets or couples, sobriety requirements and background checks.
- While some of these are necessary they raise the bar and make many of the beds in our community inaccessible contributing to un-used beds.
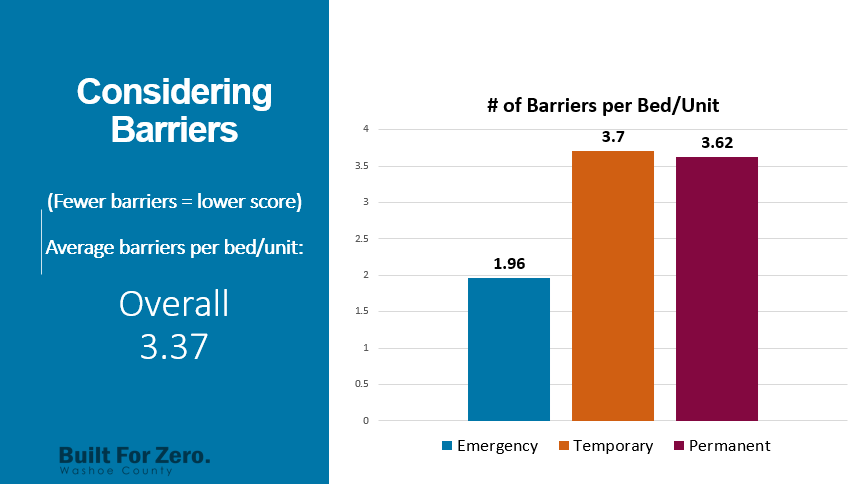
Considering Barriers
In the following graph, we assigned a point for each item that may prove to be a barrier for certain individuals.
Built for Zero Initiative
One of our goals is related to helping align the type of available beds with the needs of our unsheltered population.
- Not all barriers can be removed and some criteria is appropriate to remain. It is a delicate balance to ensure our system is effective at housing those experiencing homelessness while also considering the outcomes of those programs to ensure we are not only housing them, but also helping them.
Take-Aways & Opportunities
We have an opportunity to shift to a Housing First focus in our community to reduce costs and help better support those in need, ultimately leading us to our goal of reducing the number of people experiencing homelessness. 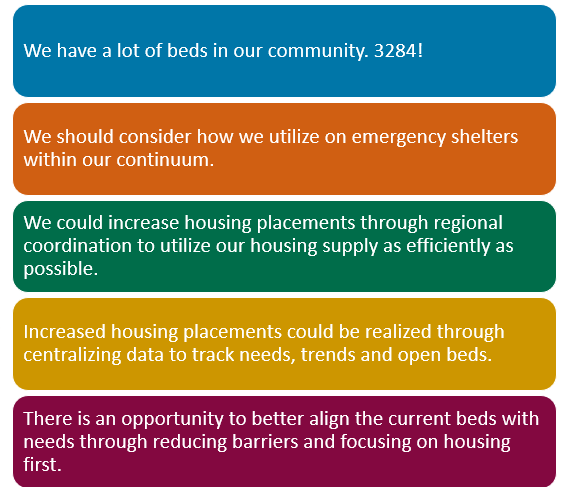
- We have a lot of beds in our community - 3,284!
- We should consider how we utilize on emergency shelters within our continuum.
- We could increase housing placements through regional coordination to utilize our housing supply as efficiently as possible.
- Increased housing placements could be realized through centralizing data to track needs, trends, and open beds.
- There is an opportunity to better align the current beds with needs through reducing barriers and focusing on housing first.
We traditionally rely heavily on our emergency shelters and the step ladder approach of emergency shelter first, then transitional housing and permanent housing. Increased housing placements could be achieved through regional coordination. For example, if we know that we do not have a lot of housing for couples we could, as a community, prioritize vouchers for couples so they can be housed together.
We can also improve our housing placements through a community wide system to identify available beds. This doesn't have to be another technology system. Improved coordination and an organized approach will help us quickly identify available beds.
Click here to view the full report
Thank you to our partners that participated!
Additional Information
If you are interested in historical data or additional information, please contact Washoe County Housing and Homeless Services at: RegionalHomelessServices@washoecounty.gov