F. Community-wide GHG Emissions Forecast
Washoe County’s 2021 community-wide (GHG) inventory includes emissions from activities and sources that took place within the County during the calendar year. Using the 2021 GHG inventory as a baseline, Washoe County’s “Business as Usual” forecast estimates that—instead of achieving Net Zero 2050—the County will create 4.23 MMT CO2e emissions in 2050 if it does not take mitigation actions.
“Business as Usual” 2050 CO2e Forecast (MMT)
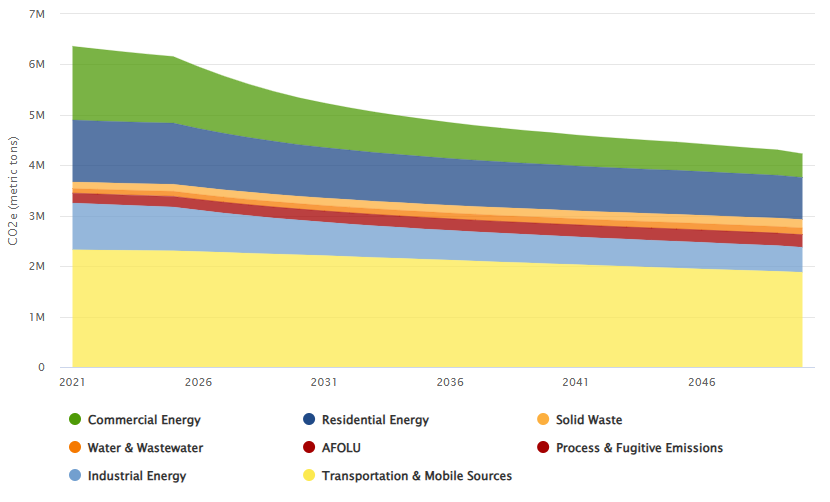
The table below shows estimated emissions by sector in 5-year intervals. The table header abbreviations are as follows: T&MS, Transportation and Mobile Sources; RE, Residential Energy; CE, Commercial Energy; IE, Industrial Energy; SW, Solid Waste; W&W, Water & Wastewater; P&F, Process & Fugitive; AFOLU, Agriculture, Forestry, and Other Land Use.
|
Community-wide GHG “Business as Usual” forecast through 2050 (MMT CO2e) |
|||||||||
|
Year |
T&MS |
RE |
CE |
IE |
SW |
W&W |
P&F |
AFOLU |
TOTAL |
|
2021 |
2.32 |
1.23 |
1.42 |
0.93 |
0.13 |
0.09 |
0.19 |
0.00 |
6.32 |
|
2025 |
2.31 |
1.21 |
1.32 |
0.87 |
0.14 |
0.10 |
0.21 |
0.00 |
6.16 |
|
2030 |
2.23 |
1.02 |
0.93 |
0.69 |
0.15 |
0.11 |
0.22 |
0.00 |
5.34 |
|
2035 |
2.14 |
0.94 |
0.74 |
0.60 |
0.15 |
0.12 |
0.23 |
0.00 |
4.91 |
|
2040 |
2.05 |
0.89 |
0.63 |
0.56 |
0.16 |
0.12 |
0.23 |
0.00 |
4.65 |
|
2045 |
1.96 |
0.87 |
0.56 |
0.53 |
0.16 |
0.13 |
0.24 |
0.00 |
4.46 |
|
2050 |
1.88 |
0.83 |
0.37 |
0.50 |
0.17 |
0.13 |
0.25 |
0.00 |
4.23 |
Methodology
The “Business as Usual” forecast incorporates two elements: 1) growth in Washoe County, and 2) “carbon intensity,” based on legislated standards.
First, for Washoe County growth inputs, the forecast uses the consensus forecast from Truckee Meadows Regional Planning Agency (TMRPA)’s 2024 Regional Plan, which estimates population and employment growth through 2044. This inventory applies the 2043 to 2044 growth rates to get estimates through 2050.
|
Washoe County Growth Forecasts |
||
|
Year |
Population |
Employment |
|
2021 |
485,113 |
316,833 |
|
2025 |
520,826 |
328,215 |
|
2030 |
546,734 |
341,111 |
|
2035 |
568,506 |
352,655 |
|
2040 |
588,016 |
365,626 |
|
2045 |
606,009 |
378,794 |
|
2050 |
624,099 |
392,239 |
The forecast applies population growth rates to most Transportation sources as well as to Residential Energy, Solid Waste, Water & Wastewater, and Process and Fugitive Emissions. The forecast applies job growth rates to on-road diesel and utility Transportation sources as well as Commercial Energy, Industrial Energy, and AFOLU.
Second, for “carbon intensity” inputs, the inventory applies two legislated standards, the Nevada State Renewable Portfolio Standard (RPS) and federal Corporate Average Fuel Economy (CAFE) Standards. First adopted by the Nevada Legislature in 1997, the RPS sets the percentage of electricity sold each year by providers of electric service to Nevada customers that must come from renewable energy (biomass, geothermal energy, solar energy, waterpower, and wind) or energy efficiency measures. In 2019 Nevada Legislature (Senate Bill 358) modified the RPS by increasing the percentage of electricity sold each year to Nevadans that must come from renewable energy or energy efficiency measures. Electric service providers must increase renewable energy at the scheduled rate until it reaches 50% in 2030:
• 22% in 2020
• 24% in 2021
• 29% in 2022 and 2023
• 34% in 2024 through 2026
• 42% in 2027 through 2029
• 50% in 2030 and each year thereafter
The Nevada State Senate Bill 358 also states a goal of 100% carbon-free resources by 2050. This forecast uses the actual carbon intensity from NV Energy’s 2021 Sustainability report, then estimates future carbon intensities at a declining rate that approaches 0 by 2050. This forecast uses “Total Owned + Purchased Generation of CO2e Emissions Intensity (MT / Net MWh),” excluding generation associated with Renewable Energy Certificates (RECs) that were not retained. The forecast converts metric tons (MT) per net megawatt (MWh) to pounds (lbs). Carbon intensity estimates from NV Energy, the largest provider of electrical power in Washoe County, would increase future forecast accuracy.
|
Estimated carbon intensity of electricity |
|
|
Year |
Estimated lbs carbon /net MWh |
|
2021 |
729.7 |
|
2025 |
604.3 |
|
2030 |
325.7 |
|
2035 |
192.3 |
|
2040 |
113.6 |
|
2045 |
62.7 |
|
2050 |
0 |
The forecast applies estimated RPS-informed carbon intensity to the following sectors: Transportation, Residential Energy, Commercial Energy, Industrial Energy, and AFOLU.
The forecast uses CAFE standards for carbon intensity estimates in the Transportation sector. First enacted by Congress in 1975, the purpose of CAFE is to reduce energy consumption by increasing the fuel economy of cars and light trucks. The CAFE standards are fleet-wide averages that must be achieved by each automaker for its car and truck fleet, each year, since 1978. This forecast uses a default transportation carbon intensity growth rate of -0.018 through 2050. The EPA regularly reviews CAFE standards. An example table of fuel efficiency standards is below (source: US Department of Energy Alternative Fuels Data Center).
|
Vehicle Fuel Efficiency (CAFE) Requirements by Year (miles per gallon) |
||
|
Year |
Passenger Cars |
Light-Duty Trucks |
|
2021 |
43.70 |
31.30 |
|
2022 |
43.70 |
31.30 |
|
2023 |
43.70 |
31.30 |
|
2024 |
49.20 |
35.10 |
|
2025 |
53.40 |
38.20 |
|
2026 |
59.40 |
42.40 |
|
2027 |
60.00 |
42.60 |
|
2028 |
61.20 |
42.60 |
|
2029 |
62.50 |
43.50 |
|
2030 |
63.70 |
44.30 |
|
2031 |
65.10 |
45.20 |
The forecast applies estimated CAFE-informed carbon intensity to the Transportation sector.
This “Business as Usual” forecast does not incorporate any additional GHG emissions reduction efforts. The Community Climate Action Plan has a list of actions to mitigate, or reduce, CO2e emissions in Washoe County. Future forecasts will include scenarios that estimate the GHG reduction potential of these actions.