A. Executive Summary
2021 Community-wide GHG emissions
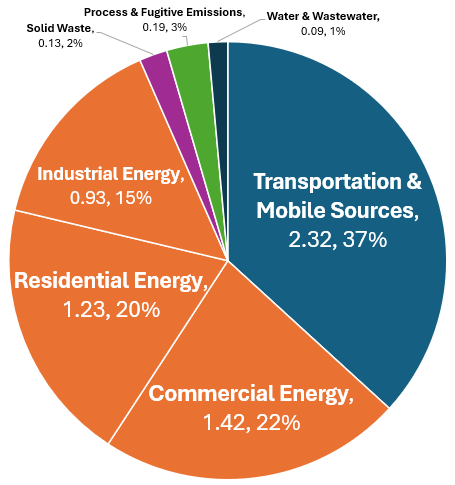
Total community wide greenhouse gas (GHG) emissions for Washoe County in 2021 were 6.32 million metric tons (MMT) carbon dioxide equivalent (CO₂e). 37% of emissions come from Transportation, 22% from Commercial Energy, 20% from Residential Energy, 15% from Industrial Energy, 2% from Solid Waste, 3% from Process & Fugitive Emissions, 1% from Water & Wastewater, and less than 1% from Agriculture, Forestry, and Other Land Use (AFOLU). This inventory includes emissions for City of Reno, City of Sparks, and Unincorporated Washoe County. It was calculated using ICLEI’s Clearpath software, and it uses 100-year global warming potentials (GWPs) from the Intergovernmental Panel on Climate Change (IPCC)’s 6th Assessment Report (AR).
2021 Washoe County Community Emissions (MMT CO2e)
| 2021 Washoe County Community Emissions | ||
| Sector | MMT CO2e | % CO2e |
| Transportation & Mobile Sources | 2.32 | 37% |
| Commercial Energy | 1.42 | 22% |
| Residential Energy | 1.23 | 20% |
| Industrial Energy | 0.93 | 15% |
| Solid Waste | 0.13 | 2% |
| Process & Fugitive Emissions | 0.19 | 3% |
| Water & Wastewater | 0.09 | 1% |
| Agriculture | 0.002 | <1% |
| Total | 6.32 | 100% |
From 2008 to 2021, community-wide emissions increased 4% from 6.09 MMT CO2e to 6.32 MMT CO2e. See Appendix 4 for 2008 and 2014 total emissions and for a comparison between the 2008, 2014, and 2021 data.
Several elements of analysis have changed in the 13 years between 2008 and 2021. Operators’ ability to retrieve and report data has improved. State and federal data sources have expanded. The science of GHG warming potentials and associated factor sets has improved. The US Community Protocol for GHG inventories has evolved. The quality of GHG analysis has thus improved with time. Previous years’ data still provides valuable point-in-time snapshots, though these differences in methodology, data inputs, and quality described above cause variability in outputs. Because of ongoing improvement of data and methods, an in-depth comparison between the most recent 2014 inventory provides the best insights about changes in emissions in our region.
The community-wide inventory in 2014 measured 4.52 MMT CO2e. About half of the 1.80 MMT CO2e difference between 2014 and 2021 comes from direct emissions growth (0.84 MMT CO2e), and the rest comes from improvements in methodology (0.96 MMT CO2e). These methodology improvements include the addition of nonroad transportation (~0.50 MMT CO2e), the expansion of “point source” stationary fuels such as motor gasoline to Industrial Energy (0.30 MMT CO2e), and the addition of Fugitive Emissions (0.19 MMT CO2e).
When the key methodology differences between the 2014 and 2021 inventories are removed, the “direct growth.” or "apples to apples" comparison between the two inventories is an 18% increase, from 4.52 MMT CO2e to 5.33 MMT CO2e.
|
Comparison of emissions (MMT CO2e), 2014 to 2021: total vs. “direct” change |
||||||
|
Sector |
2014 Total |
2021 Total |
% Total change |
MMT CO2 change due to Methods |
2021 Total w/o Method Change |
% “Direct” Change |
|
Transportation |
1.46 |
2.32 |
60% |
0.50 |
1.83 |
26% |
|
Commercial energy |
1.28 |
1.42 |
11% |
0 |
1.42 |
11% |
|
Residential energy |
1.28 |
1.23 |
(3%) |
0 |
1.23 |
(3%) |
|
Industrial energy |
0.25 |
0.93 |
266% |
0.30 |
0.63 |
148% |
|
Solid Waste |
0.20 |
0.13 |
(33%) |
0 |
0.13 |
(33%) |
|
Process & Fugitive |
0.00 |
0.19 |
- |
0.19 |
0 |
n/a |
|
Water & Wastewater |
0.03 |
0.09 |
202% |
0 |
0.09 |
202% |
|
Agriculture |
0.03 |
0.002 |
- |
(0.03) |
0 |
0% |
|
TOTAL |
4.52 |
6.32 |
40% |
0.96 |
5.33 |
18% |
GHG Emissions, compared with GDP and Population growth
The “apples to apples” emissions growth of 18% between 2014 and 2021 shows slower emissions growth than economic growth, which increased 29% over the same time period. While emissions need to decrease instead of increase to reach a Net Zero goal, a slower rate of emissions growth compared with economic growth is a better outcome than emissions matching or exceeding GDP growth.
|
Washoe County Population, GDP, and Emissions Comparison: 2014 to 2021 |
|||
|
Category |
2014 |
2021 |
% change |
|
Gross Domestic Product (GDP) in thousands chained (2017 dollars) |
$ 23,682,755 |
$30,542,848 |
29% |
|
GHG Emissions (MMT) - total |
4.52 |
6.32 |
40% |
|
GHG Emissions (MMT) – apples:apples, “direct” growth |
4.52 |
5.35 |
18% |
|
|
|
|
|
|
Population |
436,797 |
485,113 |
11% |
|
Per Capita GHG |
10.34 |
13.03 |
26% |
|
Per Capita GHG – apples:apples, “direct” growth |
10.34 |
11.04 |
7% |
Sources: population: NV State Demographer, GDP: US Bureau of Economic Analysis
Per capita emissions increased 26% from 2014 (10.34 MT CO2e) to 2021 (13.03 MT CO2e). After removing methodology-related emissions increases, per capita emissions increased 7%, from 10.34 to 11.04 MT CO2e. This 7% increase is lower than the 11% population increase over the same time frame. Similar to GDP growth comparisons, a slower rate of methodology-adjusted emissions growth is favorable to emissions matching or exceeding population growth. However, to reach net zero, overall emissions and per capita emissions must both decrease, even as the population may increase.
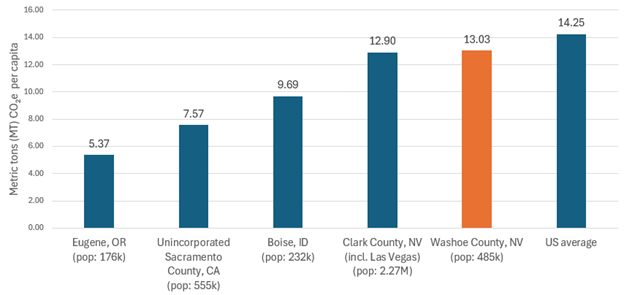
Washoe County’s per capita emissions of 13.03 MT CO2e in 2021 were lower than the national average of 14.25 MT CO2e per capita emissions, though higher than other Mountain West cities like Eugene, OR (5.37 MT CO2e), Unincorporated Sacramento County, CA (7.57 MT CO2e), Boise, ID (9.69 MT CO2e), or Clark County, NV (12.90 MT CO2e), where Las Vegas is located. Different jurisdictions may use different inventory tools and methodologies, so these numbers are directionally informative, but they are not exact comparisons.
|
Per capita annual MT CO2e in the Mountain West |
||
|
Jurisdiction |
MT CO2e |
Population |
|
Eugene, OR |
5.37 |
176,000 |
|
Unincorporated Sacramento County, CA |
7.57 |
555,000 |
|
Boise, ID |
9.69 |
232,000 |
|
Clark County, NV (incl. Las Vegas) |
12.90 |
2,270,000 |
|
Washoe County, NV |
13.03 |
485,000 |
|
US average |
14.25 |
|
Comparisons by sector between 2014 and 2021 inventories
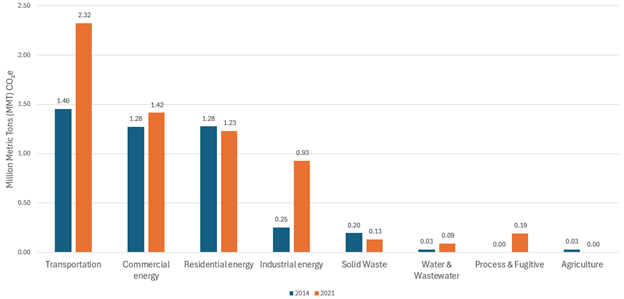
The chart below shows differences by sector that caused Washoe County’s Community-wide emissions to increase 40% from 4.52 MMT CO2e in 2014 to 6.32 MMT CO2e in 2021.
|
Comparison of emissions (MMT CO2e), 2014 to 2021: change analysis |
|||||||
|
Sector |
2014 Total |
2021 Total |
Change: Total |
% of Total |
Change: Methods |
Change: Direct |
% of Direct |
|
Transportation |
1.46 |
2.32 |
0.87 |
45% |
0.50 |
0.37 |
39% |
|
Commercial energy |
1.28 |
1.42 |
0.14 |
7% |
0 |
0.14 |
15% |
|
Residential energy |
1.28 |
1.23 |
(0.04) |
- |
0 |
(0.04) |
- |
|
Industrial energy |
0.25 |
0.93 |
0.68 |
35% |
0.30 |
0.38 |
40% |
|
Solid Waste |
0.20 |
0.13 |
(0.07) |
- |
0 |
(0.07) |
- |
|
Water & Wastewater |
0.03 |
0.09 |
0.06 |
3% |
0 |
0.06 |
6% |
|
Process & Fugitive |
0.00 |
0.19 |
0.19 |
10% |
0.19 |
0 |
- |
|
Agriculture |
0.03 |
0.002 |
(0.03) |
- |
(0.03) |
0 |
- |
|
TOTAL (net) |
4.52 |
6.32 |
1.80 |
- |
0.96 |
0.84 |
- |
|
increase |
|
|
1.94 |
100% |
0.99 |
0.95 |
100% |
|
reduction |
|
|
(0.14) |
|
(0.03) |
(0.11) |
|
Table note: “% of total” indicates the percent of total emissions growth that each sector causes. “% of direct” indicates the percent of “apples to apples” emissions growth by sector. These figures are different than % of total
Almost half of the increased emissions in Washoe County came from the Transportation sector, which had 60% more emissions in 2021 than 2014 (+0.87 MMT CO2e). Most of this difference (+0.50 MMT CO2e) is because Nonroad transportation is included in the 2021 inventory but was not calculated in 2014. The largest amount of direct emissions growth came from on-road diesel emissions, which grew 0.38 MMT CO2, or 4 times larger (0.12 to 0.50 MMT CO2e). Emissions from aviation grew 0.13 MMT, doubling from 0.12 to 0.25 MMT CO2e. On-road VMT and corresponding emissions decreased 0.14 MMT CO2e between 2014 – 2021 (1.17 to 1.03 MMT CO2e). However, some of the differences in both gasoline and diesel on-road numbers could be a result of different data sources for vehicle miles traveled (VMT) data in the 2014 inventory (RTC Washoe) versus the 2021 inventory (Google Environmental Insights Explorer).
Total Energy emissions also increased between 2014 and 2021, by 28% (0.77 MMT CO2e). Industrial energy is the largest contributor to the sector’s growth, with emissions growing 2.5 times, or 0.68 MMT CO2e, between 2014-2021 (0.25 to 0.93 MMT CO2e). Almost half of that increase (0.30 MMT CO2e) comes from methodology improvements related to calculations of emissions from stationary energy sources like fuel oil, natural gas, propane, motor gasoline. The remainder (0.38 MMT CO2e) comes from direct emissions increases of 0.35 MMT CO2e from increased electricity use and 0.03 MMT CO2e from increased natural gas use. Commercial energy grew more modestly at 11%, with a total increase of 0.14 MMT CO2e, mostly from increased electricity emissions (+0.07 MMT CO2e) and natural gas emissions (+0.06 MMT CO2e). Some of the dramatic difference between Industrial and Commercial emissions growth between 2014 to 2021 may be due, in part, to NV Energy customer classifications of industrial and commercial customers in data exports between the two inventories, as some Industrial Energy was included in the Commercial figure in 2014. Emissions nevertheless increased in both sectors in 2021.
Residential energy, meanwhile, showed a 4% (0.04 MMT CO2e) decrease in emissions between 2014 and 2021. Notably, residential electricity use grew 26% from 1.3 to 1.7 MWh, but emissions decreased 20% from 0.72 to 0.58 MMT CO2e. This is largely due to the NV Energy’s cleaning of the electrical grid. A Sustainability Report is not available for 2014, but NV Energy’s 2017 report shows an “emissions intensity” of 930 pounds per megawatt hour (lbs / MWh). This had decreased to 729 lbs / MWh by 2021. These improvements, perhaps coupled with individual household behavior changes (e.g. increased use of smart thermostats, turning off lights, etc) outpaced the increased electricity demand that likely came with 12% growth in new housing, over this time. Commercial energy shows the same effect: a 41% increase in energy use (2.3 to 3.2 MWh), but only a 7% increase in emissions, from 1.01 to 1.06 MMT CO2e.
Solid waste emissions decreased 33% between 2014 and 2021 (0.20 to 0.13 MMT CO2e), through the sector has a small amount of total emissions, so the 0.07 MMT CO2e emissions savings has a modest impact on overall emissions. Landfilled waste in Washoe County shrank almost 50% between inventories, from 571,663 tons in 2014 to 300,775 tons in 2021. This change in landfilled tonnage may be attributable to evolving data calculation methods and / or improved recycling rates. The 2014 inventory reported a recycling rate of 37.5%, while rates as of 2024 were as high as 97% for single family. The recycling rate for multi-family homes was 54.5% and for commercial accounts was 9.5%.
Water and wastewater emissions tripled between the 2014 and 2021 inventory from 0.03 to 0.09 MMT CO2e, though—similar to Solid Waste—the overall amount of emissions is very low compared with the rest of the inventory. Some of the additional emissions (0.01 MMT CO2e) came from the inclusion of providers that were not included in the 2014 inventory, including the Incline Village General Improvement District (GID), Great Basin Water Company, Sun Valley GID, and Gerlach GID, as well as the addition of the impact of septic tanks. The Truckee Meadows Water Authority (TMWA) is included in both inventories and still provides >92% of the water to the community in Washoe County. TMWA’s reported population-served of 444,182 in 2021 was almost exactly the same as the population served in 2014, with only a 5% increase in millions of gallons delivered (27.9 million in 2021). Likewise, wastewater volume only increased 6% between 2014 to 2021, to 13 million gallons of water processed. Neither of these services scaled proportionally to the 11% population growth during this time.
The 2021 inventory measures Process & Fugitive Emissions, which were not included in the 2014 report. After Transportation (0.87 MMT CO2e) and Industrial Energy (0.68 MMT CO2e), this sector has the largest contribution (0.19 MMT CO2e) to overall emissions increase between 2014 – 2021. That said, these cause a small percentage (3%) of overall emissions. Washoe County does not have reportable process emissions. Fugitive emissions in Washoe County from the distribution of natural gas as well as uses such as electric power systems, fire extinguishing, refrigeration, aerosols, foams and solvents.
And finally, emissions from Agriculture remained very small in 2021 (<1% of total emissions). Agricultural emissions appear to have decreased in 2021, but that is because the USCP “optional” category of Livestock is not included in the 2021 inventory. despite its inclusion in 2014. Livestock emissions are likely similar to the very small (0.03 MMT) amount recorded in the 2014 inventory. The Agriculture section of this inventory includes only the emissions from electricity used to serve agricultural needs. Sequestration, or carbon removals, are calculated as part of this inventory (see section E8, AFOLU), but the USCP does not require the -0.05 MMT net CO2e removals be added to gross / total emissions for a “net” total emissions number.
A detailed table with GHG sources and CO2e emissions by sector for 2021 is below. A full comparison of 2021 data with 2014 data is in Appendix 5.
Table of 2021 Washoe County Community GHG Sources and Emissions
|
2021 emissions by Fuel or Source: Transportation |
|||||
|
Org providing data |
Type |
Fuel or Source |
2021 Usage |
Usage Unit |
2021 Emissions (MT CO2e) |
|
Google EIE |
On Road |
Gasoline |
2,677,846,997 |
VMT |
1,034,447 |
|
Google EIE |
On Road |
Diesel |
347,968,818 |
VMT |
499,772 |
|
EPA NEI |
Nonroad |
Diesel |
- |
- |
387,405 |
|
EPA NEI |
Nonroad |
Gasoline |
- |
- |
90,949 |
|
EPA NEI |
Nonroad |
LPG |
- |
- |
15,158 |
|
EPA NEI |
Nonroad |
CNG |
- |
- |
1,796 |
|
RNO Airport |
Ground Ops |
Diesel |
87,846 |
Gallons |
905 |
|
RNO Airport |
Ground Ops |
Gasoline |
70,937 |
Gallons |
628 |
|
Reno-Stead Airport |
Ground Ops |
Diesel |
5,013 |
Gallons |
52 |
|
Reno-Stead Airport |
Ground Ops |
Gasoline |
1,704 |
Gallons |
15 |
|
RNO Airport |
Commercial (Passenger) |
Jet Kerosene |
14,948,972 |
Gallons |
146,246 |
|
RNO Airport |
Freight |
Jet Kerosene |
4,926,489 |
Gallons |
48,196 |
|
RNO Airport |
General Aviation |
Jet Kerosene |
4,074,471 |
Gallons |
39,861 |
|
RNO Airport |
General Aviation |
Aviation Gas |
155,118 |
Gallons |
1,294 |
|
Reno-Stead Airport |
General Aviation |
Jet Kerosene |
488,146 |
Gallons |
4,776 |
|
Reno-Stead Airport |
General Aviation |
Aviation Gas |
99,619 |
Gallons |
831 |
|
RNO Airport |
Air National Guard (ANG) |
Jet Kerosene |
842,075 |
Gallons |
8,238 |
|
EPA NEI |
Rail, Commercial |
Diesel |
- |
- |
23,113 |
|
EPA NEI |
Rail, Passenger |
Diesel |
- |
- |
702 |
|
EPA NEI |
Water, Pleasure Craft |
Gasoline |
- |
- |
14,903 |
|
EPA NEI |
Water, Pleasure Craft |
Diesel |
- |
- |
3,616 |
|
RTC Washoe |
Buses |
Electric |
1,020,784 |
kWh |
338 |
|
RTC Washoe |
Buses |
Bio-diesel |
568,890 |
Gallons |
1 |
|
RTC Washoe |
Regional Connector Bus (Carson City) |
Electric |
250,159 |
kWh |
72 |
|
RTC Washoe |
Paratransit and Flexride |
Gasoline |
13,504 |
Gallons |
122 |
|
RTC Washoe |
Paratransit and Flexride |
CNG |
179,175 |
Gallons |
118 |
|
Transportation |
Total |
|
|
|
2,323,551 |
|
2021 emissions by Fuel or Source: Commercial Energy |
|||||
|
Org providing data |
Type |
Fuel or Source |
2021 Usage |
Usage Unit |
2021 Emissions (MT CO2e) |
|
NV Energy |
Commercial |
Electricity |
3,217,822 |
MWh |
1,065,100 |
|
NV Energy |
Municipal |
Electricity |
54,895 |
MWh |
18,170 |
|
SVEC |
Commercial |
Electricity |
65 |
MWh |
19 |
|
PSREC |
Commercial |
Electricity |
57 |
MWh |
16 |
|
NV Energy |
Commercial |
Natural Gas |
51,617,010 |
Therms |
274,516 |
|
SW Gas |
Commercial |
Natural Gas |
1,738,311 |
Therms |
9,246 |
|
NV Energy |
Commercial |
LPG |
39,772 |
Therms |
2,528 |
|
EIA |
Commercial |
Fuel Oil |
356,535 |
MMBtu |
26,281 |
|
EIA |
Commercial |
Propane (HGL) |
307,917 |
MMBtu |
19,430 |
|
EIA |
Commercial |
Wood |
64,825 |
MMBtu |
632 |
|
Commercial Energy Total |
1,415,938 |
||||
|
2021 emissions by Fuel or Source: Residential Energy |
|||||
|
Org providing data |
Type |
Fuel or Source |
2021 Usage |
Usage Unit |
2021 Emissions (MT CO2e) |
|
NV Energy |
Residential |
Electricity |
1,748,938 |
MWh |
578,899 |
|
PSREC |
Residential |
Electricity |
4,882 |
MWh |
1,414 |
|
SVEC |
Residential |
Electricity |
44 |
MWh |
13 |
|
NV Energy |
Residential |
Natural Gas |
105,955,133 |
Therms |
563,504 |
|
SW Gas |
Residential |
Natural Gas |
8,171,381 |
Therms |
43,458 |
|
NV Energy |
Residential |
LPG |
221,669 |
Therms |
14,092 |
|
EIA |
Residential |
Propane (HGL) |
405,268 |
MMBtu |
24,184 |
|
EIA |
Residential |
Fuel oil |
52,861 |
MMBtu |
3,694 |
|
EIA |
Residential |
Wood |
370,027 |
MMBtu |
3,384 |
|
Residential Energy Total |
1,232,642 |
||||
|
2021 emissions by Fuel or Source: Industrial Energy |
|||||
|
Org providing data |
Type |
Fuel or Source |
2021 Usage |
Usage Unit |
2021 Emissions (MT CO2e) |
|
NV Energy |
Industrial |
Electricity |
1,598,279 |
MWh |
529,031 |
|
NV Energy |
Industrial |
Natural Gas |
19,039,233 |
therms |
101,050 |
|
EIA |
Industrial |
Fuel Oil |
3,511,184 |
MMBtu |
258,056 |
|
EIA |
Industrial |
Propane (HGL) |
161,434 |
MMBtu |
10,152 |
|
EIA |
Industrial |
Motor Gasoline |
464,122 |
MMBtu |
31,131 |
|
EIA |
Industrial |
Wood |
20,179 |
MMBtu |
41 |
|
Industrial Energy Total |
929,461 |
||||
|
2021 emissions by Fuel or Source: Solid Waste |
|||||
|
Org providing data |
Type |
Fuel or Source |
2021 Usage |
Usage Unit |
2021 Emissions (MT CO2e) |
|
WM |
Waste |
Waste Generated |
300,775 |
Tons |
130,466 |
|
WM |
Flaring |
Landfill Gas |
261,858,830 |
Cubic ft / yr |
28 |
|
WM |
Combustion |
Landfill Gas |
380,450,265 |
Cubic ft / yr |
0.53 |
|
Solid Waste Total |
130,495 |
||||
|
2021 emissions by Fuel or Source: Water & Wastewater (Wastewater) |
|||||
|
Org providing data |
Type |
Fuel or Source |
2021 Usage |
Usage Unit |
2021 Emissions (MT CO2e) |
|
TMWA |
Potable Water |
Electricity |
65,183,869 |
kWh |
28,126 |
|
TMWA |
Potable Water |
Natural Gas |
123,170 |
MMBtu |
included in elec. # |
|
IVGID |
Potable Water |
Electricity |
3,932,368 |
kWh |
1,311 |
|
IVGID |
Potable Water |
Natural Gas |
1,761 |
kWh |
included in elec. # |
|
Great Basin Water Co |
Potable Water |
Electricity |
1,346,223 |
kWh |
446 |
|
Sun Valley GID |
Potable Water |
Electricity |
517,390 |
kWh |
205 |
|
Sun Valley GID |
Potable Water |
Natural Gas |
6,271 |
MMBtu |
included in elec. # |
|
Gerlach GID |
Potable Water |
Electricity |
15,712 |
kWh |
15 |
|
Gerlach GID |
Potable Water |
Propane |
1,872 |
therms |
included in elec. # |
|
TMWRF |
Energy Use |
Electricity |
25,268,000 |
kWh |
8,483 |
|
TMWRF |
Combustion |
Digester Gas |
385,920 |
scf/day |
19 |
|
TMWRF |
Flaring |
Digester Gas |
184,320 |
scf/day |
35,075 |
|
TMWRF |
Wastewater Treatment |
Nitrification / Denitrification |
363,000 |
people |
867 |
|
TMWRF |
Effluent |
Nitrification |
216 |
Kg N / day |
169 |
|
TMWRF |
Wastewater Treatment |
Methanol |
8.9 |
MT CH3OH / day |
3,563 |
|
Washoe County |
Energy Use |
Electricity |
8,754,862 |
kWh |
2,898 |
|
Washoe County |
Wastewater Treatment |
Nitrification / Denitrification |
26,717 |
people |
64 |
|
Washoe County |
Effluent |
Nitrification |
155 |
Kg N / day |
121 |
|
Reno Stead WRF |
Energy Use |
Electricity |
5,071 |
kWh |
1,795 |
|
Reno Stead WRF |
Energy Use |
Natural Gas |
22,323 |
therms |
Included in elec. # |
|
Reno Stead WRF |
Wastewater Treatment |
Nitrification / Denitrification |
28,000 |
people |
67 |
|
Reno Stead WRF |
Effluent |
Nitrification |
41 |
Kg N / day |
32 |
|
IVGID |
Energy Use |
Electricity |
1,698,637 |
kWh |
636 |
|
IVGID |
Energy Use |
Natural Gas |
14,829 |
therms |
included in elec. # |
|
Gerlach GID |
Energy Use |
None |
125 |
people |
0 |
|
Septic |
Fugitive Emissions |
Methane |
0.09 |
Kg BOD5 / day |
6,783 |
|
Water & Wastewater Total |
90,655 |
||||
|
2021 emissions by Fuel or Source (Process & Fugitive Emissions) |
|||||
|
Org providing data |
Type |
Fuel or Source |
2021 Usage |
Usage Unit |
2021 Emissions (MT CO2e) |
|
listed above |
Fugitive |
Natural Gas |
188,150,339 |
therms |
34,741 |
|
EPA |
Fugitive |
Refrigeration |
- |
- |
106,453 |
|
EPA |
Fugitive |
Non-MDI Aerosols |
- |
- |
15,614 |
|
EPA |
Fugitive |
Electric Power Systems |
- |
- |
14,150 |
|
EPA |
Fugitive |
Foams |
- |
- |
13,455 |
|
EPA |
Fugitive |
Solvents |
- |
- |
3,027 |
|
EPA |
Fugitive |
MDI Aerosols |
- |
- |
2,455 |
|
EPA |
Fugitive |
Fire Extinguishing |
- |
- |
3,776 |
|
Process & Fugitive Emissions Total |
193,669 |
||||
|
2021 emissions by Fuel or Source (Agricultural) |
|||||
|
Org providing data |
Type |
Fuel or Source |
2021 Usage |
Usage Unit |
2021 Emissions (MT CO2e) |
|
NV Energy |
Energy Use |
Electric |
7,368,753 |
kWh |
2,439 |
|
PSREC |
Energy Use |
Electric |
96,139 |
kWh |
28 |
|
Agricultural Total |
2,467 |
||||
|
2021 emissions by Fuel or Source (Agriculture, Forestry, and Other Land Use: AFOLU) |
|||||
|
Org providing data |
Type |
Fuel or Source |
2021 Usage |
Usage Unit |
2021 Emissions (Mt CO2e) |
|
ICLEI |
Trees outside of Forests |
Emissions |
9 |
hectares |
523 |
|
ICLEI |
Trees outside of Forests |
Removals |
4,433 |
hectares |
-43,360 |
|
ICLEI |
Undisturbed Forests |
Removals |
36,255 |
hectares |
-31,046 |
|
ICLEI |
Non-Forest to Forest |
Removals |
2,469 |
hectares |
-2,913 |
|
ICLEI |
Forest Disturbances |
Emissions |
7,019 |
hectares |
10,570 |
|
ICLEI |
Forest to Grassland |
Emissions |
605 |
hectares |
15,352 |
|
ICLEI |
Forest to Other |
Emissions |
6 |
hectares |
1,245 |
|
ICLEI |
Forest to Wetland |
Emissions |
798 |
hectares |
1,112 |
|
ICLEI |
Forest to Settlement |
Emissions |
60 |
hectares |
701 |
|
ICLEI |
Forest to Cropland |
Emissions |
0.1 |
hectares |
0 |
|
Forests & Trees Total |
-47,816 |
||||