Appendix 4: Total emissions from 2008 and 2014 Community-wide Inventories
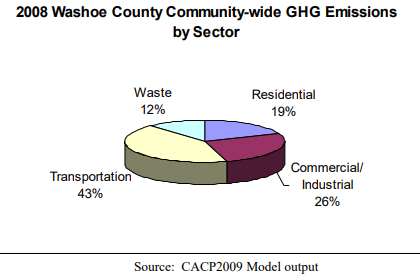
The Community-Wide GHG Inventory from 2008 reported total emissions of 6.09 MMT CO2E, with Transportation causing 43% of emissions, Commercial / Industrial Energy 26%, Residential Energy 19%, and Waste 12%.
|
Washoe County Community Emissions Summary 2008 |
||
|
Sector |
CO2e (MT) |
% of Total |
|
Transportation |
2,605,371 |
43% |
|
Residential Energy |
1,155,619 |
19% |
|
Commercial / Industrial Energy |
1,612,383 |
26% |
|
Waste |
720,028 |
12% |
|
TOTAL |
6,093,401 |
100% |
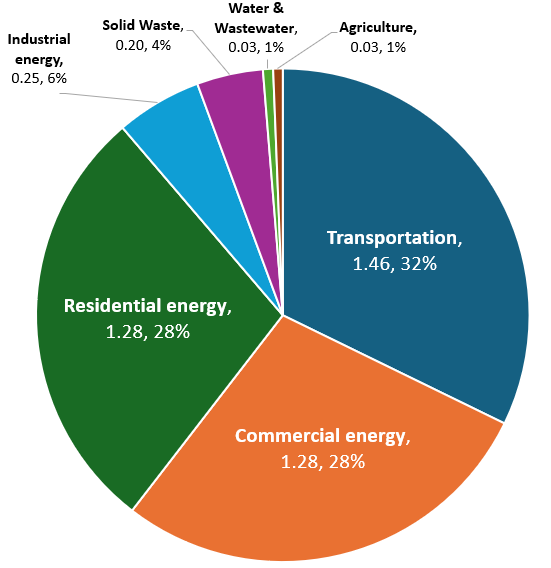
The Community-Wide GHG Inventory from 2014 reported total emissions of 4.516 MMT CO2E. Transportation caused 32% of emissions, Residential Energy 28%, Commercial Energy 28%, Industrial Energy 6%, Solid Waste 4%, Water & Wastewater 1%, and Agriculture 1%.
|
Washoe County Community Emissions Summary, 2014 |
||
|
Sector |
CO2e (MT) |
% of Total |
|
Transportation |
1,455,397 |
32% |
|
Residential Energy |
1,277,392 |
28% |
|
Commercial Energy |
1,275,550 |
28% |
|
Industrial Energy |
253,922 |
6% |
|
Solid Waste |
195,051 |
4% |
|
Water & Wastewater |
30,472 |
1% |
|
Agriculture |
28,196 |
1% |
|
TOTAL |
4,515,980 |
100% |
The table below shows a comparison of emissions by sector from 2008, 2014, and 2021. Several elements of analysis have changed in the 13 years between 2008 and 2021. Operators’ ability to retrieve and report data has improved. State and federal data sources have expanded. The science of GHG warming potentials and associated factor sets has improved. The US Community Protocol for GHG inventories has evolved. The quality of GHG analysis has thus improved with time. Previous years’ data still provides valuable point-in-time snapshots, though the differences in methodology, data inputs, and quality described above cause variability in the outputs.
|
2008 – 2014 – 2021 CO2e comparison by sector (MMT CO2e) |
|||||||
|
Sector |
2008 |
2014 |
2021 |
’08-21 % |
’08-21 MMT |
’14-21 % |
’14-21 MMT |
|
Transportation |
2.61 |
1.46 |
2.32 |
-11% |
-0.28 |
60% |
0.87 |
|
Commercial |
1.61 |
1.28 |
1.42 |
-12% |
-0.19 |
11% |
0.14 |
|
Residential |
1.16 |
1.28 |
1.23 |
7% |
0.08 |
-3% |
-0.04 |
|
Industrial |
0.00 |
0.25 |
0.93 |
n/a |
0.00 |
266% |
0.68 |
|
Solid Waste |
0.72 |
0.20 |
0.13 |
-82% |
-0.59 |
-33% |
-0.07 |
|
Water & Wastewater |
0.00 |
0.03 |
0.09 |
n/a |
0.00 |
202% |
0.06 |
|
Process & Fugitive |
0.00 |
0.00 |
0.19 |
n/a |
0.00 |
n/a |
0.19 |
|
Agriculture |
0.00 |
0.03 |
0.00 |
n/a |
0.00 |
-91% |
-0.03 |
|
Total |
6.09 |
4.52 |
6.32 |
4% |
0.23 |
40% |
1.80 |
|
|
|
|
|
|
|
|
|
|
Population (NV State Demographer) |
426,966 |
436,797 |
485,113 |
|
|
|
|
|
Per Capita Emissions (MT CO2e) |
14.27 |
10.34 |
13.03 |
|
|
|
|
As noted in the previous table, the 2014 and 2021 inventories include data from additional fields, preventing an “apples to apples” comparison between the total GHG numbers for the three inventories. To assist in comparative analysis, the table below shows line-item comparisons to 2014 and 2021 of usage data and emissions data for all fields included in the 2008 inventory.
|
“Apples to apples” comparison of 2008, 2014 and 2021 inventory usage and emissions (MT CO2e) data - Transportation |
||||||||
|
Type |
Fuel or Source |
2008 Usage |
2014 Usage |
2021 Usage |
Unit |
2008 CO2e |
2014 CO2e |
2021 CO2e |
|
On-Road |
Gasoline |
- |
3,153,538,462 |
2,677,846,997 |
VMT |
2,025,044 |
1,171,675 |
1,034,447 |
|
On-Road |
Diesel |
- |
124,177,808 |
347,968,818 |
VMT |
499,021 |
116,748 |
499,772 |
|
Nonroad |
Gasoline |
- |
no data |
- |
Gallons |
198 |
no data |
90,949 |
|
Passenger RTIA |
Jet Kerosene |
- |
28,077,281 |
14,948,972 |
Gallons |
47,935 |
115,618 |
146,246 |
|
Rail, Comm |
Diesel |
- |
2,827,241 |
- |
Gallons |
29,045 |
29,142 |
23,110 |
|
Rail, Pass |
Diesel |
- |
76,070 |
- |
Gallons |
804 |
784 |
702 |
|
Transportation |
TOTAL |
- |
- |
- |
- |
2,602,047 |
1,455,397 |
2,323,551 |
|
“Apples to apples” comparison of 2008, 2014 and 2021 inventory usage and emissions (MT CO2e) data - Commercial Energy |
||||||||
|
Type |
Fuel or Source |
2008 Usage |
2014 Usage |
2021 Usage |
Unit |
2008 CO2e |
2014 CO2e |
2021 CO2e |
|
Commercial |
Electricity |
2,862,688 |
2,282,107 |
3,217,822 |
MWh |
1,178,072 |
1,013,061 |
1,065,100 |
|
Commercial |
Natural Gas |
70,734,406 |
42,064,472 |
53,355,321 |
Therms |
376,279 |
223,678 |
283,762 |
|
Commercial |
LPG |
0 |
No data |
39,772 |
Therms |
19,811 |
No data |
2,528 |
|
Commercial |
Fuel Oil |
0 |
16,965 |
356,535 |
MMBtu |
1,843 |
1,245 |
26,281 |
|
Commercial |
Kerosene |
0 |
319,555 |
none |
MMBtu |
34,699 |
24,226 |
none |
|
Commercial |
TOTAL |
- |
- |
- |
- |
1,610,704 |
1,262,210 |
1,377,671 |
|
“Apples to apples” comparison of 2008, 2014 and 2021 inventory usage and emissions (MT CO2e) data - Residential Energy |
||||||||
|
Type |
Fuel or Source |
2008 Usage |
2014 Usage |
2021 Usage |
Unit |
2008 CO2e |
2014 CO2e |
2021 CO2e |
|
Residential |
Electricity |
1,389,642 |
1,384,243 |
1,748,938 |
MWh |
571,875 |
720,265 |
578,899 |
|
Residential |
Natural Gas |
99,309,151 |
90,629,880 |
114,126,514 |
Therms |
528,285 |
481,923 |
606,962 |
|
Residential |
LPG |
- |
not collected |
221,669 |
Therms |
28,217 |
No data |
14,092 |
|
Residential |
Propane (HGL) |
- |
484,849 |
405,268 |
MMBtu |
195 |
29,675 |
24,184 |
|
Residential |
Kerosene |
- |
70,948 |
not in data |
- |
4,043 |
5,378 |
no data |
|
Residential |
Fuel oil |
- |
496,510 |
49,620 |
MMBtu |
23,004 |
36,437 |
3,694 |
|
Residential |
TOTAL |
- |
- |
- |
- |
1,155,619 |
1,273,678 |
1,227,831 |
|
“Apples to apples” comparison of 2008, 2014 and 2021 inventory usage and emissions (MT CO2e) data - Industrial Energy |
||||||||
|
Type |
Fuel or Source |
2008 Usage |
2014 Usage |
2021 Usage |
Unit |
2008 CO2e |
2014 CO2e |
2021 CO2e |
|
Industrial |
LPG |
- |
no data |
no data |
Therms |
1,138 |
no data |
no data |
|
Industrial |
Fuel Oil |
- |
4,979 |
3,511,184 |
MMBtu |
540 |
364 |
258,056 |
|
Industrial |
TOTAL |
- |
- |
- |
- |
1,678 |
364 |
258,056 |
|
“Apples to apples” comparison of 2008, 2014 and 2021 inventory usage and emissions (MT CO2e) data - Solid Waste |
||||||||
|
Type |
Fuel or Source |
2008 Usage |
2014 Usage |
2021 Usage |
Unit |
2008 CO2e |
2014 CO2e |
2021 CO2e |
|
Waste |
Waste Generated |
889,251 |
571,662 |
300,775 |
Tons |
720,028 |
185,679 |
130,466 |
|
Waste |
TOTAL |
- |
- |
- |
- |
720,028 |
185,679 |
130,466 |
|
“Apples to apples” comparison of 2008, 2014 and 2021 inventory usage and emissions (MT CO2e) data - Summary |
||||||||
|
Analysis |
Detail |
2008 Usage |
2014 Usage |
2021 Usage |
Unit |
2008 CO2e |
2014 CO2e |
2021 CO2e |
|
TOTAL emissions |
2008 line items only |
- |
- |
- |
- |
6,090,076 |
4,117,328 |
5,317,575 |
|
- |
- |
- |
- |
- |
- |
- |
- |
- |
|
Emissions Growth |
2008 line items only |
- |
- |
- |
2008 to… |
n/a |
-31% |
-13% |
|
Emissions Growth |
2008 line items only |
- |
- |
- |
2014 to... |
n/a |
n/a |
27% |
|
- |
- |
- |
- |
- |
- |
- |
- |
- |
|
Population |
- |
- |
- |
- |
- |
426,966 |
436,797 |
485,113 |
|
Per Capita Emissions |
2008 line items only |
- |
- |
- |
- |
14.26 |
9.56 |
10.96 |
|
- |
- |
- |
- |
- |
- |
- |
- |
- |
|
TOTAL emissions |
complete inventories |
- |
- |
- |
- |
6,093,401 |
4,515,980 |
6,318,880 |
|
Per Capita Emissions |
complete inventories |
- |
- |
- |
- |
14.27 |
10.34 |
13.03 |