H. How will we know if environmental health is improving?
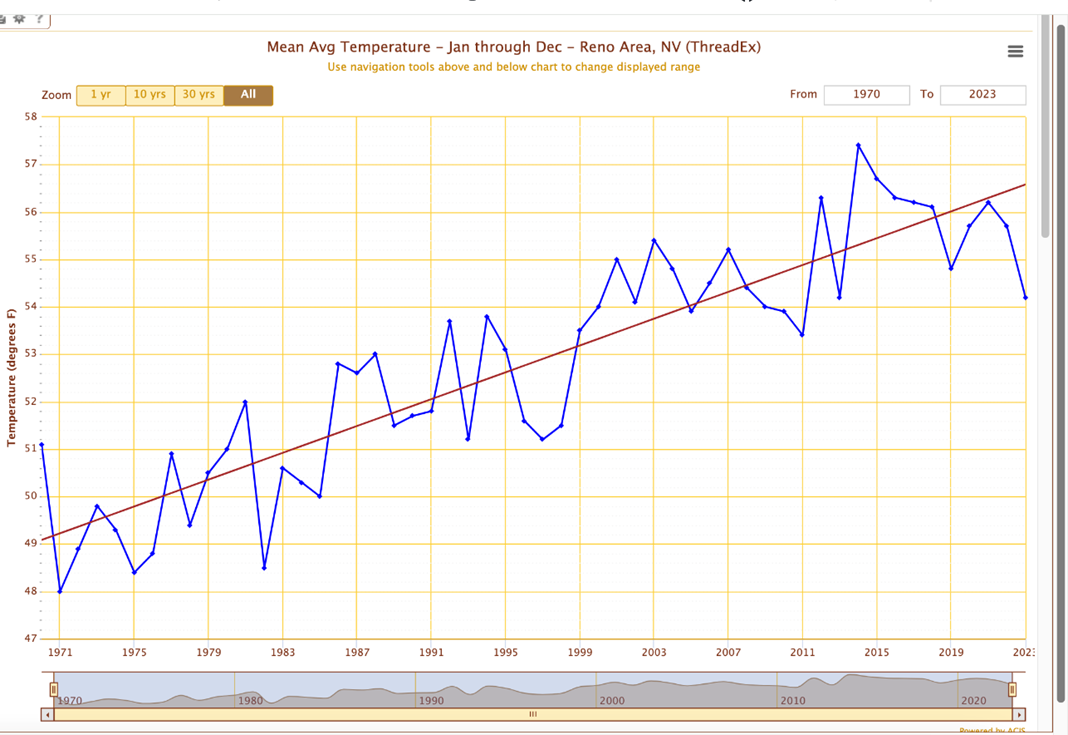
We will use standard measures for environmental health outcomes. We want to see the annual average temperature of Reno stay the same or decrease. Since 1970, the average annual average temperature trend has increased from 49 degrees Fahrenheit in 1970 to 50.4°F in 1980 to 52°F in 1990 to 53.4°F in 2000 to 54.8°F in 2010 to 56.4°F in 2020 (source: Climate Central).
Mean Average Temperature, Jan through Dec, 1970 - 2023; Reno Area, NV
And we want to maintain 365 days each year in Washoe County with an Air Quality Index (AQI) of Green (Good) or Yellow (Moderate). We will omit days with emergency events like local fire conditions when we do our calculations because these events, though caused by climate change, are acute (one time) and not systemic (ongoing).
|
AQI Basics for Ozone and Particle Pollution |
|||
|
Daily AQI Color |
Levels of Concern |
Values of Index |
Description of Air Quality |
|
Green |
Good |
0 to 50 |
Air quality is satisfactory, and air pollution poses little or no risk. |
|
Yellow |
Moderate |
51 to 100 |
Air quality is acceptable. However, there may be a risk for some people, particularly those who are unusually sensitive to air pollution. |
|
Orange |
Unhealthy for Sensitive Groups |
101 to 150 |
Members of sensitive groups may experience health effects. The general public is less likely to be affected. |
|
Red |
Unhealthy |
151 to 200 |
Some members of the general public may experience health effects; members of sensitive groups may experience more serious health effects. |
|
Purple |
Very Unhealthy |
201 to 300 |
Health alert: The risk of health effects is increased for everyone. |
|
Maroon |
Hazardous |
301 and higher |
Health Warning of emergency conditions: everyone is more likely to be affected. |
Finally, we will look for reduced areas of Environmental Justice Concern in the County, based on the Environmental Protection Agency's (EPA's) map.