Appendix 2: Community Clean Air survey feedback
1. How important is it to you that Washoe County reduces its emissions?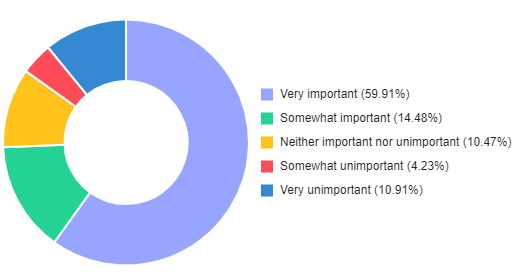
| How important is it to you that Washoe County reduces its emissions? | ||
| Answer Option | Count | Percentage |
| Very important | 269 | 60% |
| Somewhat important | 65 | 15% |
| Neither important nor unimportant | 47 | 10% |
| Somewhat unimportant | 19 | 4% |
| Very unimportant | 49 | 11% |
| Total | 449 | 100% |
2. How important is "Green" / "Good" air quality to you, as measured by the Air Quality Index (AQI)?"
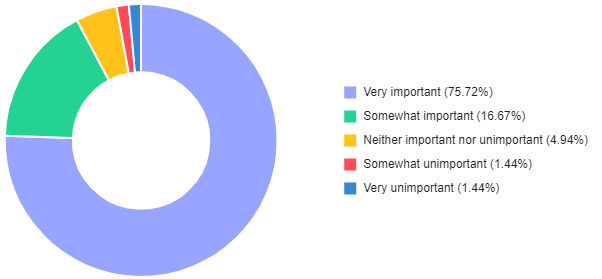
| How important is “Green” / “Good” air quality to you, as measured by the Air Quality Index (AQI)? |
||
| Answer Option | Count | Percentage |
| Very important | 368 | 76% |
| Somewhat important | 81 | 17% |
| Neither important nor unimportant | 24 | 5% |
| Somewhat unimportant | 7 | 1% |
| Very unimportant | 7 | 1% |
| Total | 487 | 100% |
3. How important is it to you that the heat index ("feels like" temperature) is less than 90° F / 32° C on any given day?
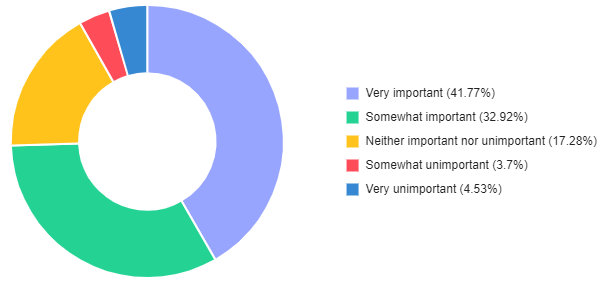
| How important is it to you that the heat index (“feels like" temperature) is less than 90° F / 32° C on any given day? |
||
| Answer Option | Count | Percentage |
| Very important | 203 | 42% |
| Somewhat important | 160 | 33% |
| Neither important nor unimportant | 84 | 17% |
| Somewhat unimportant | 18 | 4% |
| Very unimportant | 22 | 4% |
| Total | 487 | 100% |
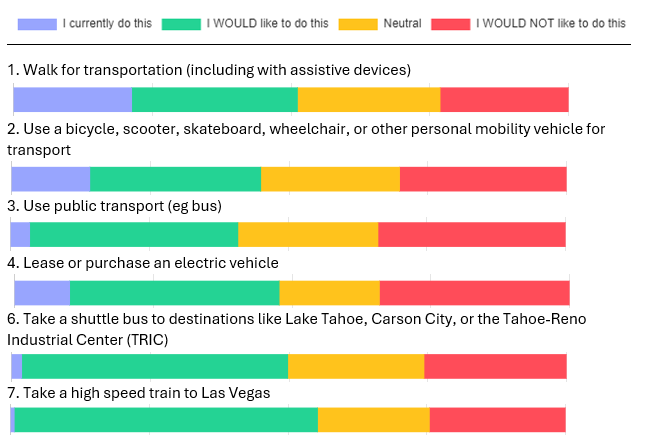
4. If these transportation options were affordable and convenient for you, would you like to do any of the following? “Transportation” here is defined as a trip for which the primary purpose is not exercise or recreation.
|
If these transportation options were affordable and convenient for you, would you like to do any of the following? |
|||||
|
Answer Option |
I currently do this |
I WOULD like to do this |
Neutral |
I WOULD NOT like to do this |
Total |
|
Walk for transportation (including with assistive devices) - % |
21% |
30% |
26% |
23% |
100% |
|
Walk for transportation - count |
92 |
129 |
111 |
100 |
432 |
|
Use a bicycle, scooter, skateboard, wheelchair, or other personal mobility vehicle for transport - % |
14% |
31% |
25% |
30% |
100% |
|
Use a bicycle, scooter, skateboard, wheelchair, or other personal mobility vehicle for transport - count |
61 |
133 |
108 |
130 |
432 |
|
Use public transport (e.g. bus) - % |
3% |
38% |
25% |
34% |
100% |
|
Use public transport (e.g. bus) - count |
15 |
162 |
109 |
146 |
432 |
|
Lease or purchase an electric vehicle - % |
10% |
1% |
18% |
34% |
100% |
|
Lease or purchase an electric vehicle - count |
43 |
163 |
78 |
148 |
432 |
|
Take a shuttle bus to destinations like Lake Tahoe, Carson City, or the Tahoe-Reno Industrial Center (TRIC) - % |
2% |
48% |
24% |
26% |
100% |
|
Take a shuttle bus – count |
8 |
207 |
106 |
111 |
432 |
|
Take a high speed train to Las Vegas - % |
0% |
55% |
20% |
25% |
100% |
|
Take a high speed train to Las Vegas - count |
3 |
236 |
87 |
106 |
432 |
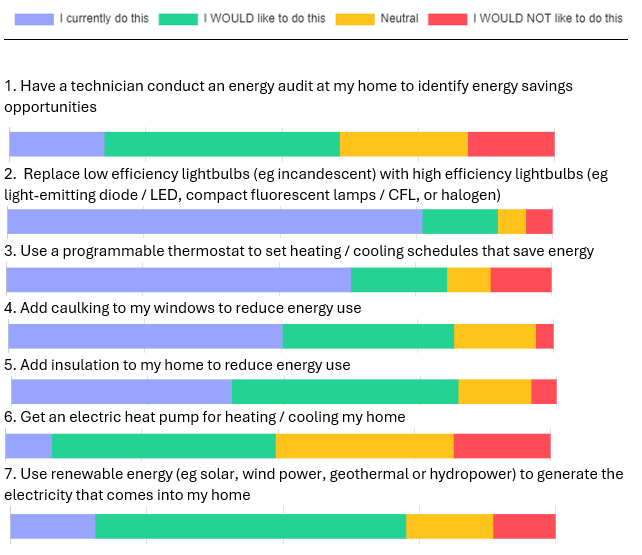
5. If these residential energy use options were affordable and easy for you, would you like to do any of these?
|
Answer Option |
I currently do this |
I WOULD like to do this |
Neutral |
I WOULD NOT like to do this |
Total |
|
Have a technician conduct an energy audit at my home to identify energy savings opportunities - % |
17% |
43% |
23% |
16% |
100% |
|
Energy audit - count |
74 |
184 |
100 |
68 |
426 |
|
Replace low efficiency lightbulbs (e.g. incandescent) with high efficiency lightbulbs (e.g. light-emitting diode / LED, compact fluorescent lamps / CFL, or halogen) - % |
76% |
14% |
5% |
5% |
100% |
|
Efficient lightbulbs - count |
324 |
59 |
22 |
21 |
426 |
|
Use a programmable thermostat to set heating / cooling schedules that save energy |
63% |
18% |
8% |
11% |
100% |
|
Program thermostat – count |
269 |
75 |
34 |
48 |
426 |
|
Add caulking to my windows to reduce energy use - % |
50% |
32% |
15% |
3% |
100%
|
|
Window caulking – count |
214 |
134 |
64 |
14 |
426 |
|
Add insulation to my home to reduce energy use - % |
40% |
42% |
13% |
5% |
100% |
|
Add insulation – count |
172 |
177 |
57 |
20 |
426 |
|
Get an electric heat pump for heating / cooling my home - % |
8% |
41% |
33% |
18% |
100% |
|
Electric heat pump – count |
36 |
175 |
139 |
76 |
426 |
|
Use renewable energy (e.g. solar, wind power, geothermal or hydropower) to generate electricity that comes into my home - % |
16% |
57% |
16% |
11% |
100% |
|
Renewable Energy - count |
66 |
243 |
68 |
49 |
426 |
Demographic Details
We are including some demographic details about survey respondents. Our goal was for the identities of survey respondents to mirror the demographics of Washoe County. Some demographics (eg Hispanics, renters, adults younger than 55 years old) are under-represented in survey results, so we have reached out to community groups affiliated with those demographics to hear feedback directly in small group sessions.
6. What best describes where you live?
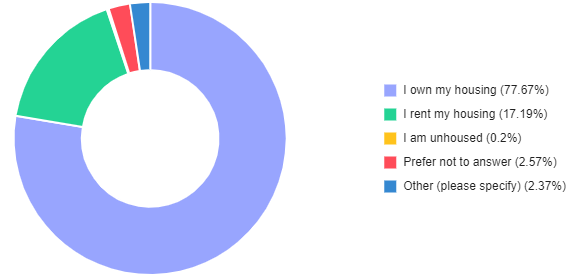
| What best describes where you live? | ||
| Answer Option | Count | Percentage |
| I own my housing | 393 | 78% |
| I rent my housing | 87 | 17% |
| I am unhoused | 1 | 0% |
| Prefer not to answer | 13 | 2.5% |
| Other (please specify) | 12 | 2.5% |
| Total | 506 | 100% |
7. What is your race and / or ethnicity? (select all that apply)
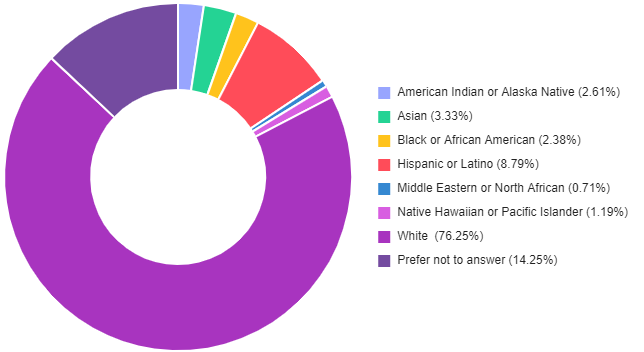
| What is your race and / or ethnicity? (select all that apply) | ||
| Answer Option | Count | Percentage |
| American Indian or Alaska Native | 11 | 2% |
| Asian | 14 | 3% |
| Black or African American | 10 | 2% |
| Hispanic or Latino | 37 | 8% |
| Middle Eastern or North African | 3 | 1% |
| Native Hawaiian or Pacific Islander | 5 | 1% |
| White | 321 | 70% |
| Prefer not to answer | 60 | 13% |
| Total | 461 | 100% |
8. Select which age group you are currently in:
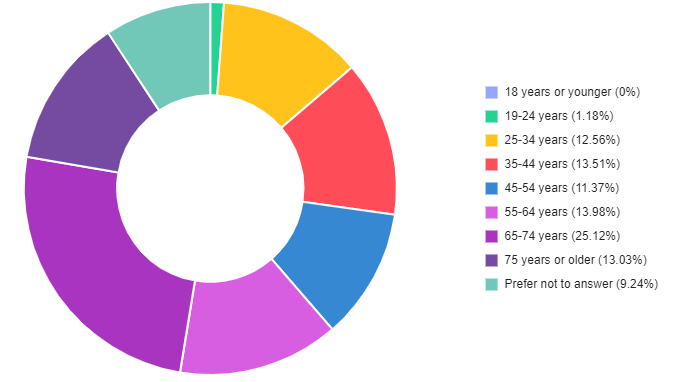
| Select which age group you are currently in | ||
| Answer Option | Count | Percentage |
| 18 years or younger | 0 | 0% |
| 19 - 24 years | 5 | 1% |
| 25 - 34 years | 53 | 13% |
| 35 - 44 years | 57 | 14% |
| 45 - 54 years | 48 | 11% |
| 55 - 64 years | 59 | 14% |
| 65 - 74 years | 106 | 25% |
| 75 years or older | 55 | 13% |
| Prefer not to answer | 39 | 9% |
| Total | 422 | 100% |