C. County Operations GHG Inventory
In 2021, Washoe County contracted Ledger8760 (now nZero) to track all energy use and emissions from County operations. nZero measures facility energy-use and cost data using data from the County’s electricity and gas meters. Per data industry best practices to calculate emissions, all GHG inventory and emissions calculations follow the internationally recognized GHG Protocol.
Figure 1: Washoe County emissions for 2021, our baseline year (Source: nZero)
|
Scope |
Type |
MT CO2e |
% |
|
Scope 1 |
Natural gas |
4,099 |
13% |
|
Fleet gasoline |
2,848 |
9% |
|
|
Fleet diesel |
1,403 |
4% |
|
|
Scope 1 |
8,350 |
26% |
|
|
Scope 2 |
Purchased electricity |
12,091 |
37% |
|
Scope 2 |
12,091 |
37% |
|
|
Scope 3 |
Employee commute |
8,735 |
27% |
|
Waste |
3,425 |
10% |
|
|
Scope 3 |
12,160 |
37% |
|
|
Total |
32,601 |
100% |
In 2021, Washoe County measured 32,601 metric tons (MT) of greenhouse gas (GHG) emissions. 8,349 (35%) of emissions were Scope 1; 12,091 (51%) were Scope 2; and 3,425 (14%) were Scope 3.
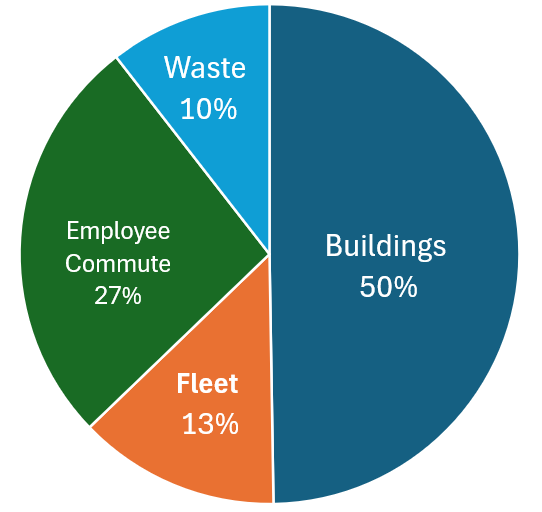
As Figure 1 demonstrates, the County measures different categories of emissions, called Scopes:
Scope 1 – Direct Emissions
- Stationary Combustion (Natural gas)
- Mobile Combustion (Vehicle fleet)
- Fugitive Emissions from Refrigeration/AC
Scope 1 emissions are from natural gas boilers and internal combustion engine (ICE)-powered fleet vehicles. Natural gas use is measured by natural gas meter readings using Washoe County’s Energy Manager software. Fleet fuel, mileage and utilization data are tracked using Flagship Fleet Management software.
Table 1 Scope 1 emissions from building heat and fleets
| 2021 Washoe County Scope 1 Emissions | |
| Fuel Type | Emissions (MT CO2e) |
| Natural gas (buildings) | 4,054 |
| Fleet gasoline | 2,848 |
| Fleet diesel | 1,403 |
| Total | 8,305 |
The County has not yet inventoried emissions from fugitive refrigerants. The County will develop an inventory protocol for these emissions in FY26 and develop a reduction plan by 2028.
Scope 2 – Indirect Emissions
- Purchased electricity, heat, steam, or cooling
Scope 2 emissions are produced by Nevada Energy when they generate electricity (using coal or natural gas) to power the County’s buildings, streetlights and other facilities. These data are based on metered electricity use as tracked by Energy Master software and confirmed by nZero.
Although the County manages more than 400 buildings and facilities, more than 90% of the County’s Scope 2 emissions come from 25 buildings and facilities:
Table 2 Scope 1 & 2 emissions for Washoe County facilities
| Site Name | Electricity (Scope 2) GHG (MT) | Natural Gas GHG (MT) | Total GHG (MT) | % Emissions | Combined % |
| 911 Parr - Consolidated Detention Facility | 2,327.69 | 1,393.96 | 3,721.65 | 24.0% | 24% |
| STMWRF unit @Mira Loma | 2,944.61 | 0.14 | 2,944.75 | 19.0% | 43.0% |
| Courts Bldg North Tower | 1,128.67 | 250.97 | 1,379.64 | 8.9% | 51.8% |
| Admin Complex ( 9th St. Bldg A-D) | 772.88 | 267.15 | 1,040.03 | 6.7% | 58.5% |
| Jan Evans Juvenile Center | 423.92 | 386.92 | 810.84 | 5.2% | 63.8% |
| Liberty Center | 283.58 | 199.36 | 482.94 | 3.1% | 66.9% |
| Courts Main - Old Jail - 75 Court | 298.42 | 113.43 | 411.85 | 2.7% | 69.5% |
| Fieldcreek Pump Station | 384.65 | 0.00 | 384.65 | 2.5% | 72.0% |
| Reoc Emergency Ops Ctr | 347.62 | 31.69 | 379.31 | 2.4% | 74.5% |
| Our Place | 177.75 | 168.81 | 346.56 | 2.2% | 76.7% |
| Longley Complex | 155.74 | 190.12 | 345.86 | 2.2% | 78.9% |
| Medical Examiner (9th St. Bldg F) | 227.83 | 60.38 | 288.21 | 1.9% | 80.8% |
| Downtown Reno Library | 177.77 | 80.91 | 258.68 | 1.7% | 82.4% |
| Rivermount Park | 181.32 | 45.32 | 226.64 | 1.5% | 83.9% |
| Rancho San Rafael Regional Park | 122.59 | 102.20 | 224.79 | 1.4% | 85.4% |
| Cold Springs WRF | 220.48 | 0.00 | 220.48 | 1.4% | 86.8% |
| Street Lights | 205.45 | 0.00 | 205.45 | 1.3% | 88.1% |
| Reno Senior Center (9th St. Bldg E) | 125.38 | 65.39 | 190.77 | 1.2% | 89.3% |
| Sierra View Library | 114.93 | 0.00 | 114.93 | 0.7% | 90.1% |
| Tech Services - Edison | 81.49 | 17.64 | 99.13 | 0.6% | 90.7% |
| North Valleys Regional Park | 73.21 | 21.92 | 95.13 | 0.6% | 91.3% |
| Sparks Justice Court | 66.31 | 25.18 | 91.49 | 0.6% | 91.9% |
| Spanish Springs Library | 63.95 | 20.49 | 84.44 | 0.5% | 92.5% |
| Lift Station - Steamboat | 83.77 | 0.00 | 83.77 | 0.5% | 93.0% |
| Kids Kottage Ii | 44.98 | 33.88 | 78.86 | 0.5% | 93.5% |
| South Valleys Library | 51.06 | 24.58 | 75.64 | 0.5% | 94.0% |
| Sparks Library | 36.19 | 29.04 | 65.23 | 0.4% | 94.4% |
| Northwest Library | 39.88 | 24.45 | 64.33 | 0.4% | 94.8% |
| Incline Roads Maintenance | 60.36 | 0.00 | 60.36 | 0.4% | 95.2% |
| Sober 24 Adult Services | 50.12 | 10.12 | 60.24 | 0.4% | 95.6% |
| Tb Clinic | 32.74 | 27.50 | 60.24 | 0.4% | 96.0% |
| Galena Creek Regional Park | 54.94 | 0.00 | 54.94 | 0.4% | 96.3% |
| Transitional Housing | 30.74 | 22.25 | 52.99 | 0.3% | 96.7% |
| Lemmon Valley WWT Plant | 50.80 | 0.00 | 50.80 | 0.3% | 97.0% |
| Bartley Ranch Regional Park | 24.26 | 21.89 | 46.15 | 0.3% | 97.3% |
| Incline Library | 43.07 | 0.00 | 43.07 | 0.3% | 97.6% |
| South Valleys Regional Park | 42.29 | 0.00 | 42.29 | 0.3% | 97.9% |
| Kids Kottage Activity Center | 23.39 | 15.34 | 38.73 | 0.2% | 98.1% |
| Public Administrator (new) | 26.60 | 9.28 | 35.88 | 0.2% | 98.3% |
| Bowers Mansion Regional Park | 35.44 | 0.00 | 35.44 | 0.2% | 98.6% |
| Incline Sheriff Substation | 32.75 | 0.00 | 32.75 | 0.2% | 98.8% |
| North Valley Library | 18.98 | 11.33 | 30.31 | 0.2% | 99.0% |
| Mcgee Child Advocacy Ctr (C.A.C.) At Kids Kottage | 27.82 | 0.14 | 27.96 | 0.2% | 99.2% |
| Liberty Center Parking Garage | 26.64 | 0.00 | 26.64 | 0.2% | 99.3% |
| Family Engagement Center - Social Services | 17.06 | 8.94 | 26.00 | 0.2% | 99.5% |
| Lazy 5 Regional Park | 19.93 | 5.03 | 24.96 | 0.2% | 99.7% |
| Sparks Senior Center | 16.40 | 5.82 | 22.22 | 0.1% | 99.8% |
| Lift Station - Woodland Village | 15.72 | 0.00 | 15.72 | 0.1% | 99.9% |
| Lift Station - Diamond Peak | 15.52 | 0.00 | 15.52 | 0.1% | 100.0% |
| Fleet | 4,250.63 | ||||
| Totals | 11,827.73 | 3,691.57 | 15,519.30 | Goal: | 8,535.62 |
| Social Cost of Carbon (global cost of impacts) | $2,330,116 | $771,842 | $3,244,371 |
*Methodology note: For NVE-supplied energy, the annual average emission factor for 2021 is: 811.17 lbs/MWh (or 0.000368 MT CO2e/kWh). However, we are using a slightly lower emission factor that considers the time-of-use for most County operations (mainly during the day, when more solar production contributes to the grid) and the grid's carbon intensity for 2021. The emissions factor used for this inventory is: 803.74 lbs CO2e/MWh (or 0.000365 MT CO2e/kWh).
Scope 3 – Indirect Emissions
- Travel
- Employee Commuting
- Purchased goods
- Waste
Scope 3 emissions are varied and diverse. Washoe County has only recently begun to account for them. They include emissions associated with everything the County buys and throws away, as well as service contracts and employee business travel and commuting expenses. The full extent of Scope 3 emissions is still to be determined.
To date, the County has addressed Scope 3 emissions in the following ways:
- Washoe County conducted an employee commuting survey during the summer of 2023. With 1,040 responses out of ~3,000 employees, here are some notable results:
- The average employee commute is 23 miles.
- Commuting employees produced 2.8 mtCO2e, for a total of 8,400 mtCO2e for 2023.
- These emissions have been added to the above calculation for County emissions in 2021.
- 10.3% of employees commuted using alternative methods (bicycles, carpooling, public transit).
Scope 3 reduction strategies are discussed in our Facility Decarbonization Plan below.
Comparing County Operational Emissions with Past Inventories
In 2008, Washoe County completed an inventory of GHG emissions from Facilities, Fleets and Operations in 2008, shown in Table 4, below:
| Type | 2008 MT CO2e | 2021 MT CO2e | Change |
| Buildings | 27,450 | 16,190 | -41% |
| Fleet | 5,627 | 4,251 | -24% |
| Employee Commute | 8,257 | 8,735 | 6% |
| Waste | 6,059 | 3,425 | -43% |
| TOTAL | 47,393 | 32,601 | -31% |
Although Washoe County will continue to compare our energy use and emissions reductions against our 2008 inventory, the County will be using 2021 as the baseline year for emissions calculations, because reporting methodologies have become more accurate and thorough since our last inventories in 2008 and 2014. Emissions reduction goals, e.g. “45% emissions reduction by 2030,” will be measured against 2021 emissions numbers wherever possible.