EMS Response
REMSA Health Response Zones
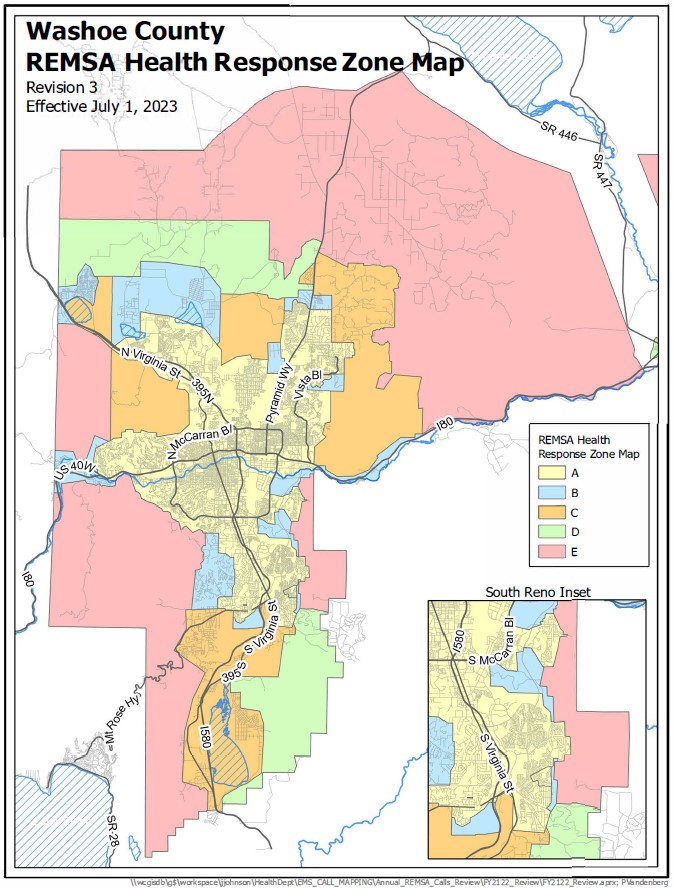
REMSA Health, a non-profit private ambulance company, provides ground ambulance transport for City of Sparks, City of Reno, and the Truckee Meadows Fire Protection District service areas. This map illustrates the designated response expectations for presumptively defined life-threatening calls (Priority 1 calls) within those service areas. This is also known as the REMSA Health Franchise Response Zones. Each zone (A-E) corresponds to a different time for expected response. These response times are as follows:
- Zone A – eight (8) minutes and fifty-nine (59) second or less
- Zone B – fifteen (15) minutes and fifty-nine (59) seconds or less
- Zone C – twenty (20) minutes and fifty-nine (59) seconds or less
- Zone D - thirty (30) minutes and fifty-nine (59) seconds or less
- Zone E – as quickly as possible
The REMSA Health Response Zone Map is reviewed annually, and changes are made, if needed, based on population growth and population density. The review process includes annual reviews and census year reviews. The map is created by the EMS Oversight Program and Washoe County Regional Services Geographic Information Systems. It is review by the EMS Oversight Program, REMSA Health and approved by the District Board of Health. The last revision to the map was effective July 1, 2023.
Last modified on 08/15/2023
Let’s Stay in Touch
Sign up for our newsletter